Methodology
This section provides technical details regarding the algorithm used for the
detection of anomalies along profile.
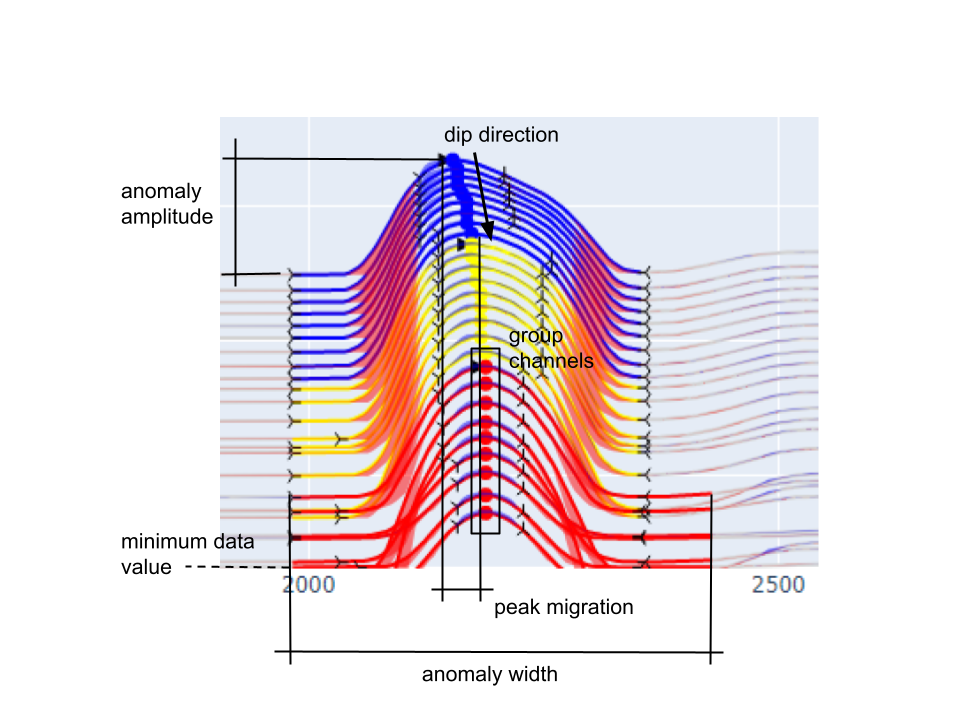
Anomalies are identified from the detection of maximum, minimum and inflection
points calculated from the first and second order derivatives of individual
data channels.
Detection parameters are available for filtering and grouping co-located
anomalies. The selection process is done in the following order:
Primary detection
Loop over the selected data channels:
Apply the Minimum Data Value threshold.
For every maximum (peak) found on a profile, look on either side for
inflection and minimum points. This forms an anomaly.
Keep all anomalies larger than the Minimum Amplitude
Grouping
Anomalies found along individual data channels are grouped based on spatial
proximity:
Find all peaks within the Maximum Peak Migration distance. The nearest peak is
used if multiple peaks are found on a single channel.
Create an anomaly group that satisfies the following criteria:
Detection Parameters
Masking Data
property PeakFinderParams. masking_data : Data | None
Mask object to focus peak finding within an area of interest.
Masking data is used to filter out data points that are not considered by the algorithm.
This is useful for focusing on specific regions of interest.
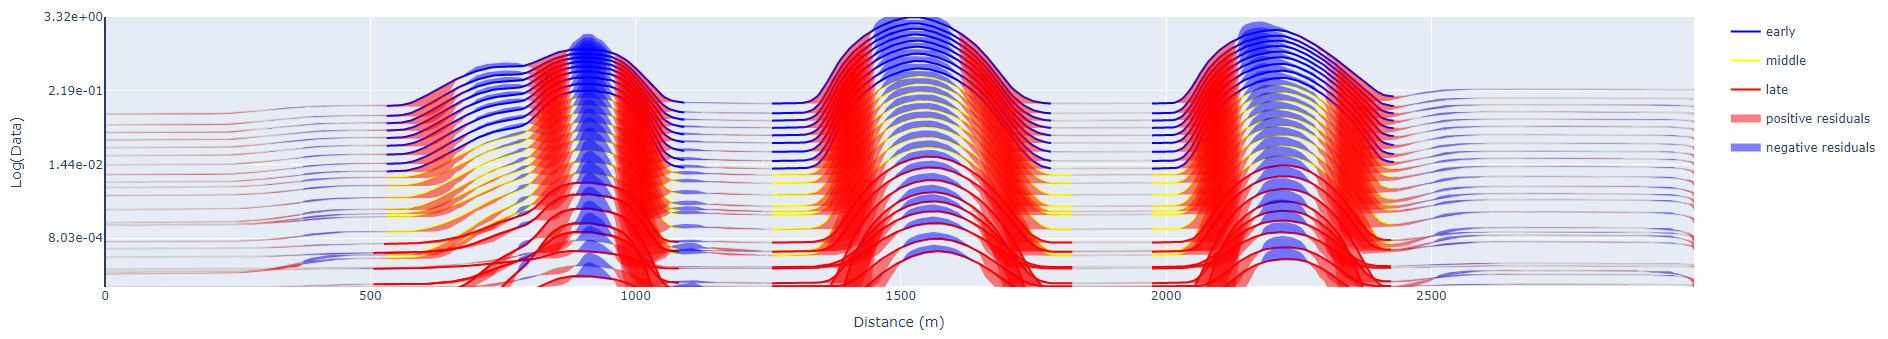
Smoothing
property PeakFinderParams. smoothing : int
Number of neighbors used in running mean smoothing.
The running mean replaces each data by the average of it’s N
\[d_i = \frac{1}{N}\sum_{j=-\frac{N}{2}}^{\frac{N}{2}}d_{i+j}\]
where averaging becomes one sided at both ends of the profile. The result is a
smoothed data set where the degree of smoothing scales with the number of
neighbours used in the mean.
Fig. 2 The residual between the original and smoothed data.
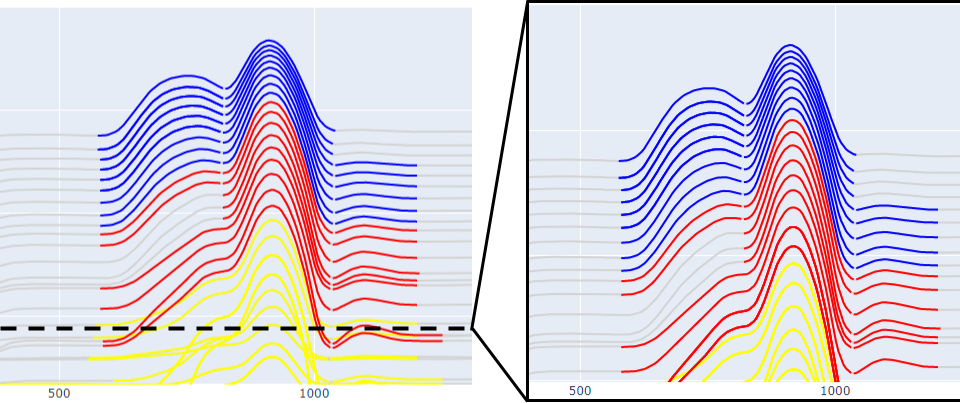
Minimum Amplitude
property PeakFinderParams. min_amplitude : int
Threshold on the minimum amplitude of the anomaly, expressed as
a percent of the height scaled by the minimum value.
Threshold value (\(\delta A\) ) for filtering small anomalies based on the anomaly
minimum (\(d_{min}\) ) and maximum (\(d_{max}\) ).
\[\delta A = \left|\left|\frac{d_{max} - d_{min}}{d_{min}}\right|\right| \cdot 100\]
See figure
Minimum Data Value
property PeakFinderParams. min_value : float
Minimum absolute data value to be considered for anomaly detection.
The minimum data threshold (\(\delta_d\) ) (see Figure
\[\begin{split}\begin{equation}
d_i =
\begin{cases}
d_i & \;\text{for } d_i > \delta_d \\
nan & \;\text{for } d_i \leq \delta_d\\
\end{cases}
\end{equation}\end{split}\]
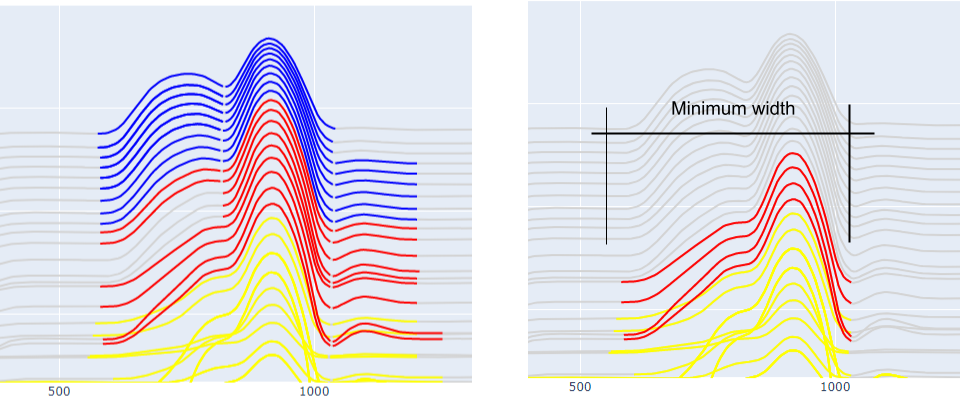
Minimum Width
property PeakFinderParams. min_width : float
Minimum anomaly width (m) measured between start and end of bounding minima.
The minimum distance (m) between the start and the end of an anomaly group to be considered.
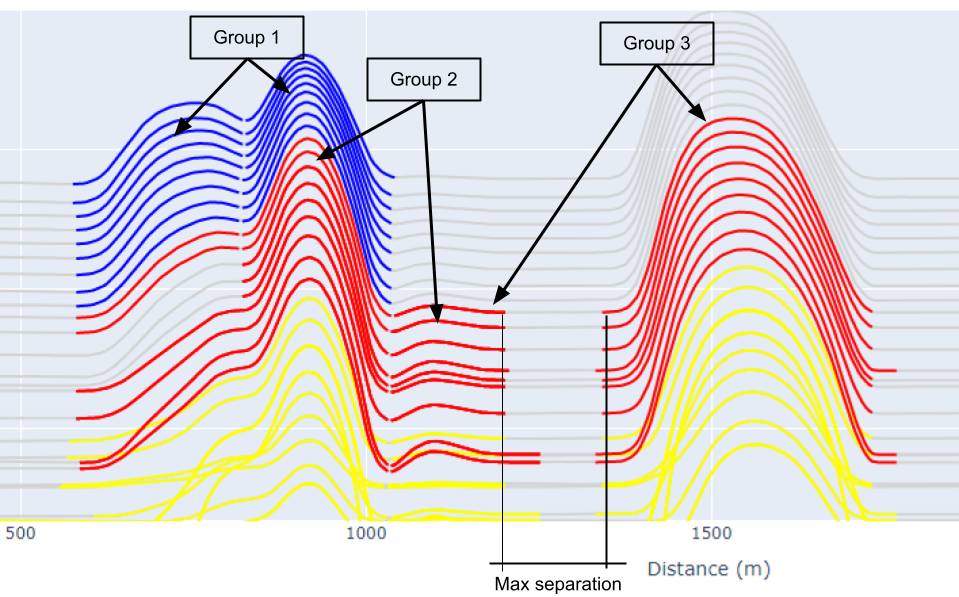
Maximum Peak Migration
property PeakFinderParams. max_migration : float
Threshold on the lateral shift (m) of peaks within a grouping of anomalies.
The maximum distance (m) between the peaks within a group of anomalies. This
parameter depends on the Minimum number of channels
See figure
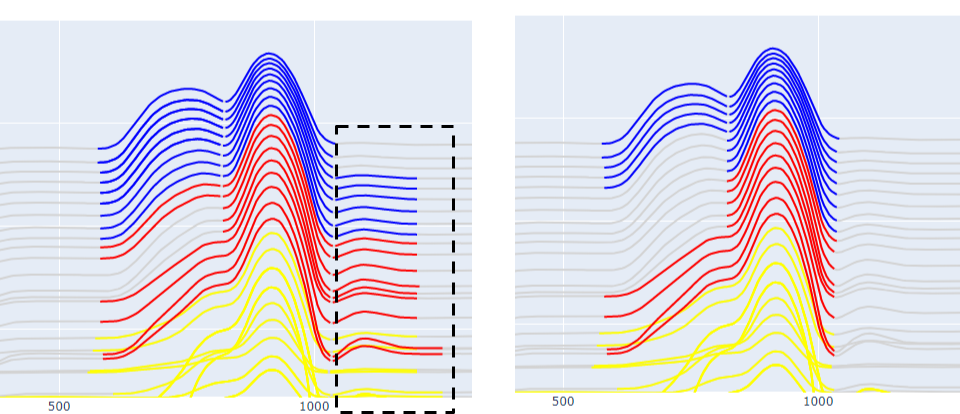
Minimum number of channels
property PeakFinderParams. min_channels : int
Minimum number of data channels required to form a group.
The minimum number of data channels required to form a group of anomalies.
See figure
Merge N Peaks
property PeakFinderParams. n_groups : int
Number of consecutive peaks to merge into a single anomaly.
Post-grouping of anomalies based on the number of consicutive peaks. The parameter
depends on the Max Group Separation
Max Group Separation
property PeakFinderParams. max_separation : float
Maximum separation between peaks to merge into single anomaly.
The maximum distance (m) between the start and the end of a neighboring groups.