User interface
The main entry point is the peak_finder.ui.json file
(stored under peak-finder-assets)
for the peak-finder application that can be rendered by Geoscience ANALYST. The interface has two sections:
General Parameters (required)
ui.json interface
The ui.json interface has two sections:
1. General Parameters
The general parameters must be set before running the application, regardless of the mode of operation.
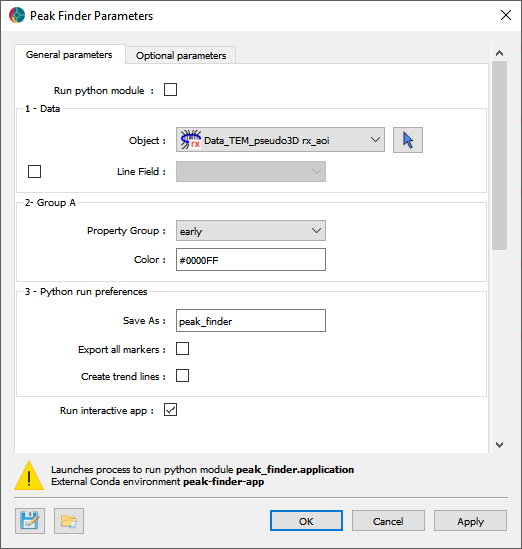
Object: Curve entity containing the data and line ID information.
Line Field: [Optional] Referenced data defining the line identifier. If omitted, the line ID is inferred from the unique curve parts.
Property Group: Property group data to be used in the detection and grouping. To add more groups, see the Optional Parameters section.
Color: Hex color code used to label the peaks identified. A default value is provided that will suffice in most cases.
Save as: Name of the output group holding the results.
Export all markers: If selected, all markers will be exported to the output group. If not selected, only the peak group centers will be exported.
Create trend lines: If selected, trend lines are created connecting the peak group centers across survey lines. See the Trend Line documentation page for more information.
Run interactive app: If selected, the ui.json parameters will be used to initialize an interactive application. In this mode, any changes made through the ui will override the values set in the ui.json. Without the run interactive app checkbox selected, the application will be run in a terminal with the parameters set in the ui.json (standalone mode).
2. Optional Parameters
These parameters are required to run in Standalone, but not necessary to run the application in Interactive mode.
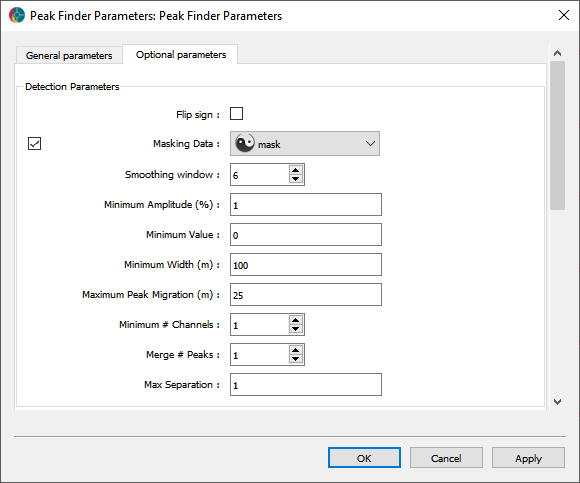
Note that the group parameters have no equivalent in the interactive application, and must be set in the optional parameters tab. If a user wishes to find peaks in more than one group of time channels, say, they must add the groups here.
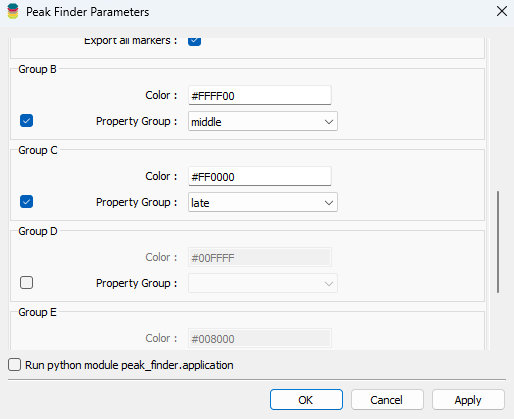
Fig. 1 Groups can be added by checking the box to enable and selecting a property group and color representation.
To learn more about the algorithm and its parameters, see the methodology section. To see how the parameters are exposed in each of the application modes visit the interactive and standalone pages