Interactive Application
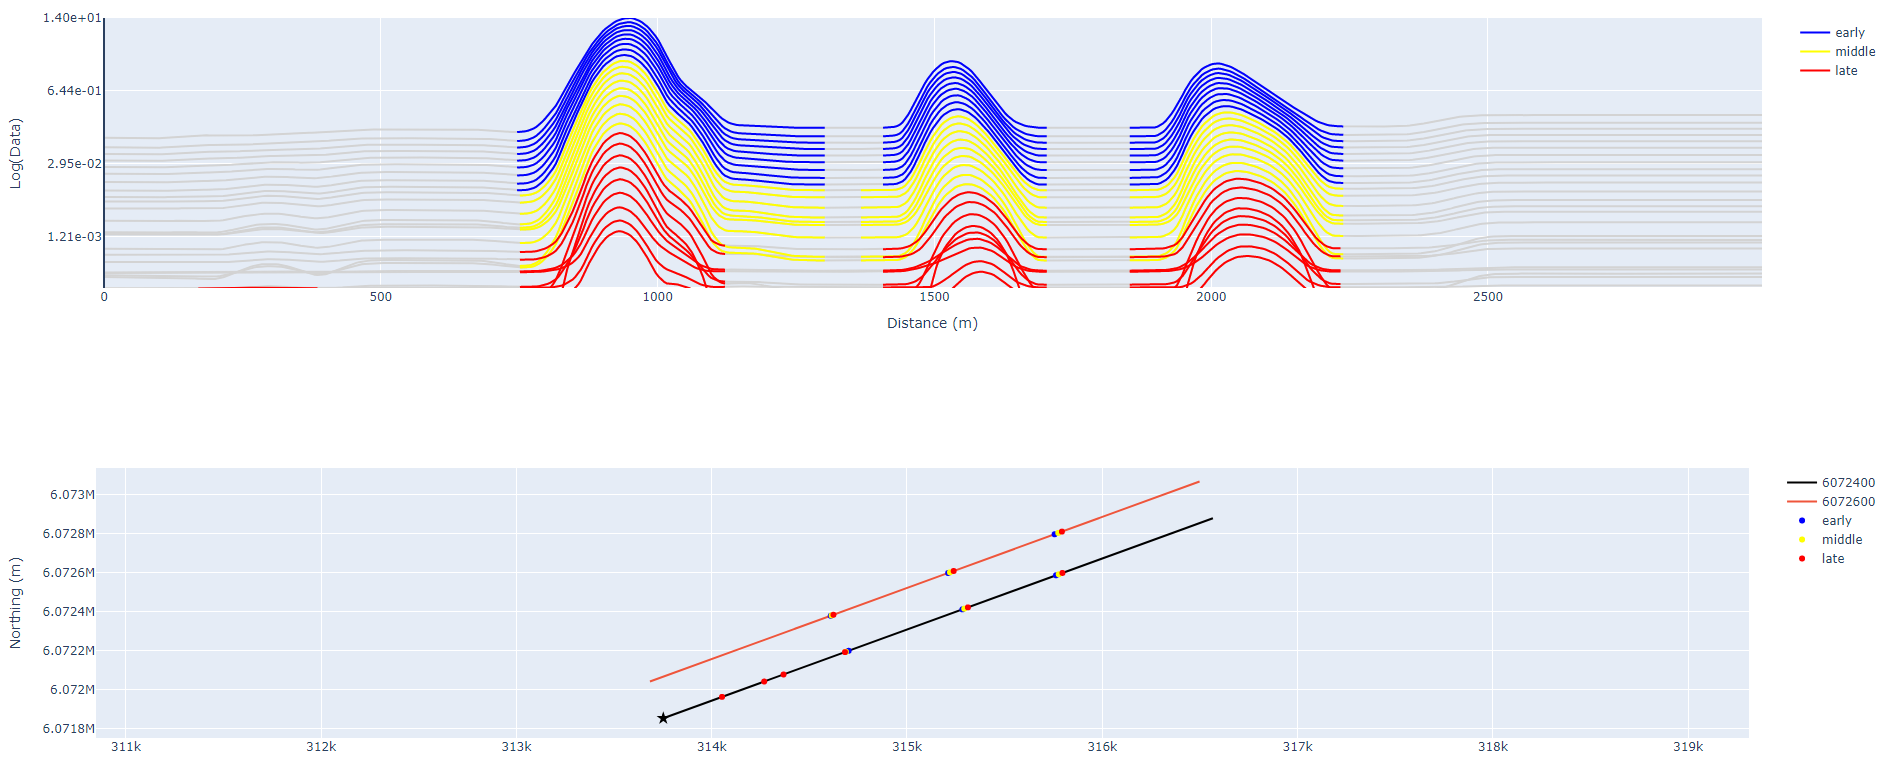
If you are using peak-finder through the interactive application you will see a window with visualizations and ui controls. The visualization contains both a section of data along a single line and a plan view to locate the chosen and adjacent lines and anomaly picks in cartesian space.
The ui controls section is divided into three subsections:
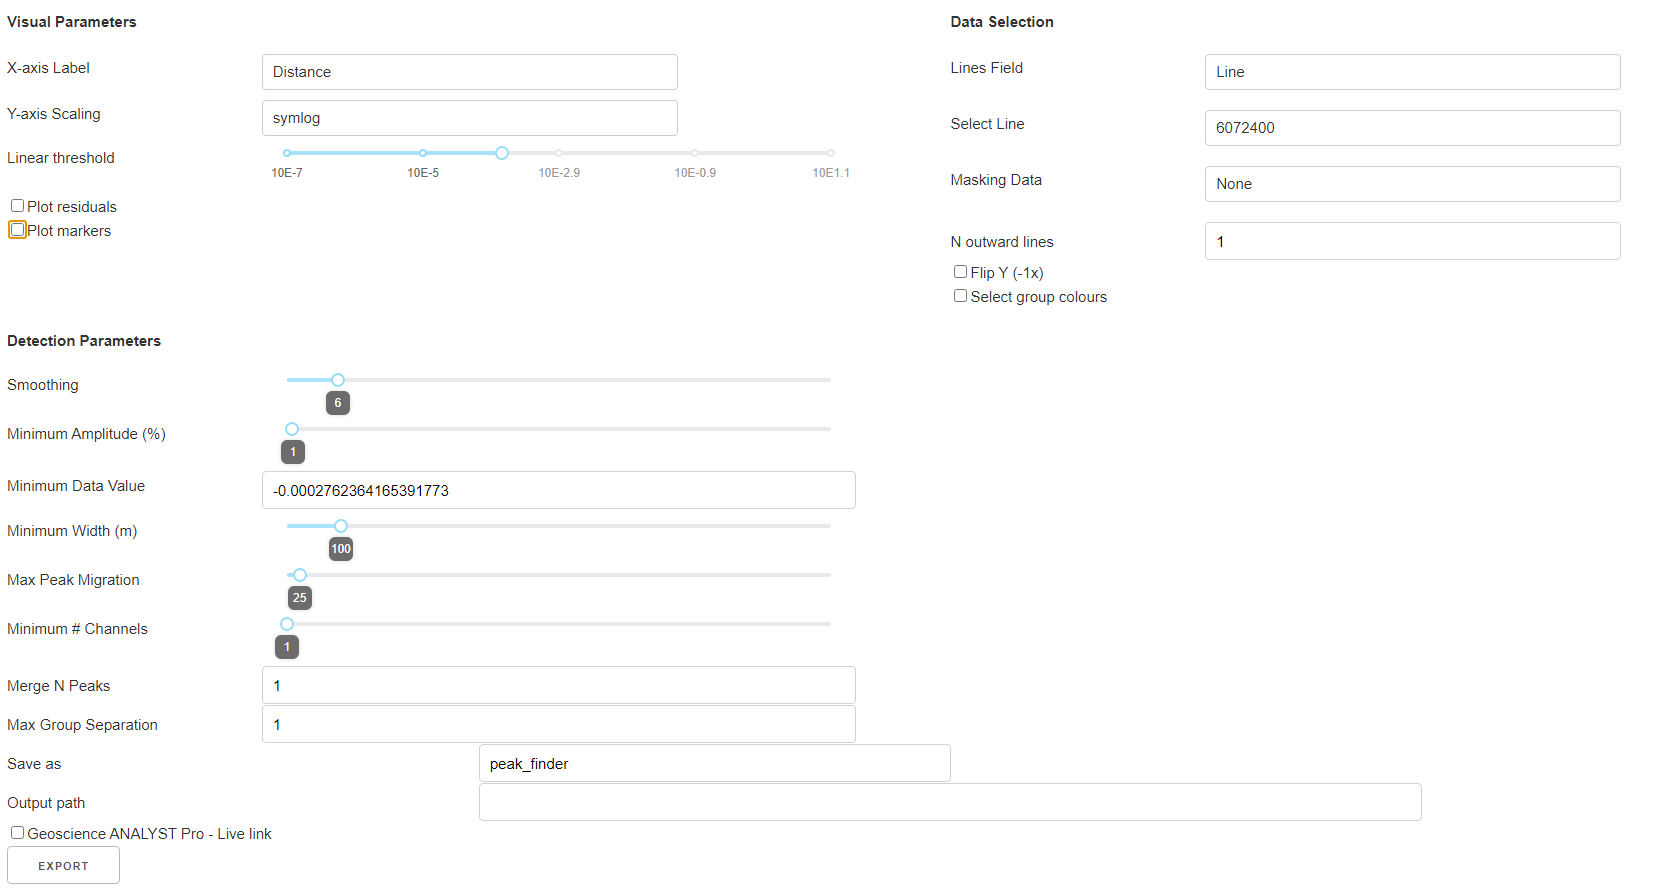
Visual Parameters
This section controls the appearance of the plotting area.
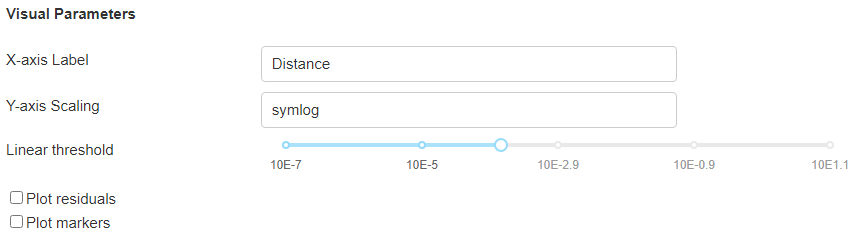
X-axis Label
Updates the label on the data section view x-axis.
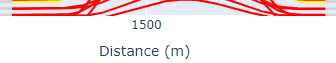
Fig. 2 The x-axis label is updated to reflect the selection.
Y-axis Scaling
Updates the scaling of the y-axis of the data section view
Todo
Add a figure showing data with both linear and symlog scaling
Linear threshold
When Symlog is chosen for Y-axis scaling, this parameter will set the region in which linear scaling is used.
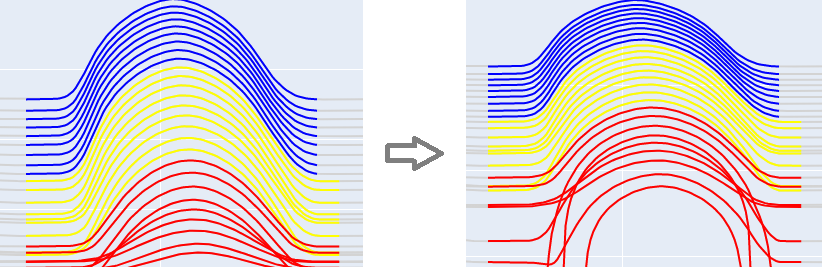
Fig. 3 Comparing the data visualization with a symlog linear threshold set to 10E-3.2 (left) and 10E-5.1 (right).
Plot residuals
Switches on and off the residual visualization that shows the difference between the raw and smoothed data. See the Smoothing section for more details.
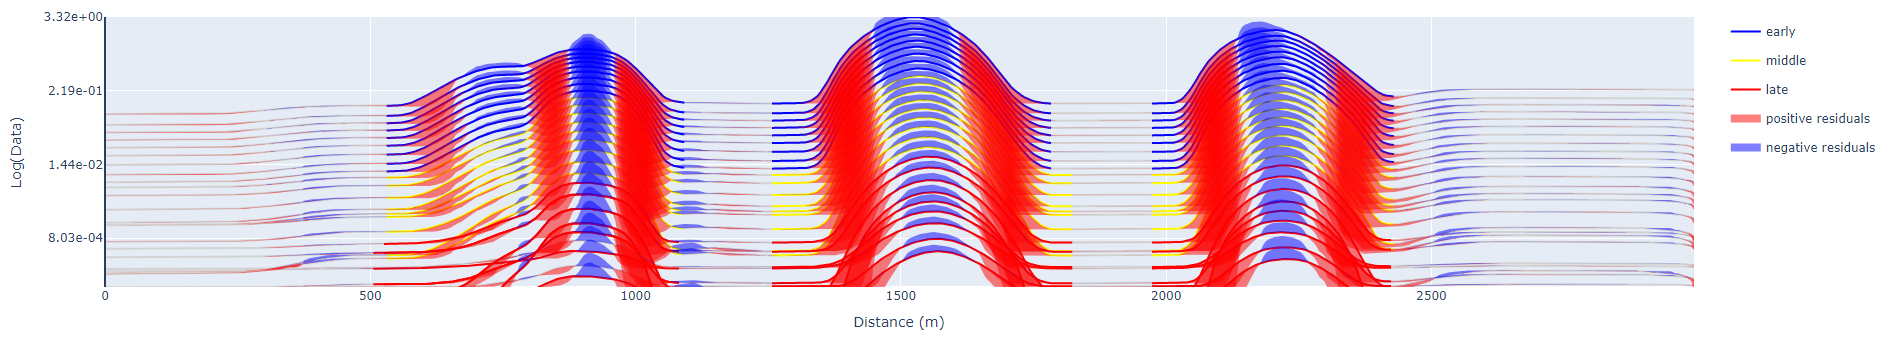
Fig. 4 The residual layer is used to show the effect of the smoothing factor.
Plot markers
Switches on and off the markers outlining the character of each anomaly
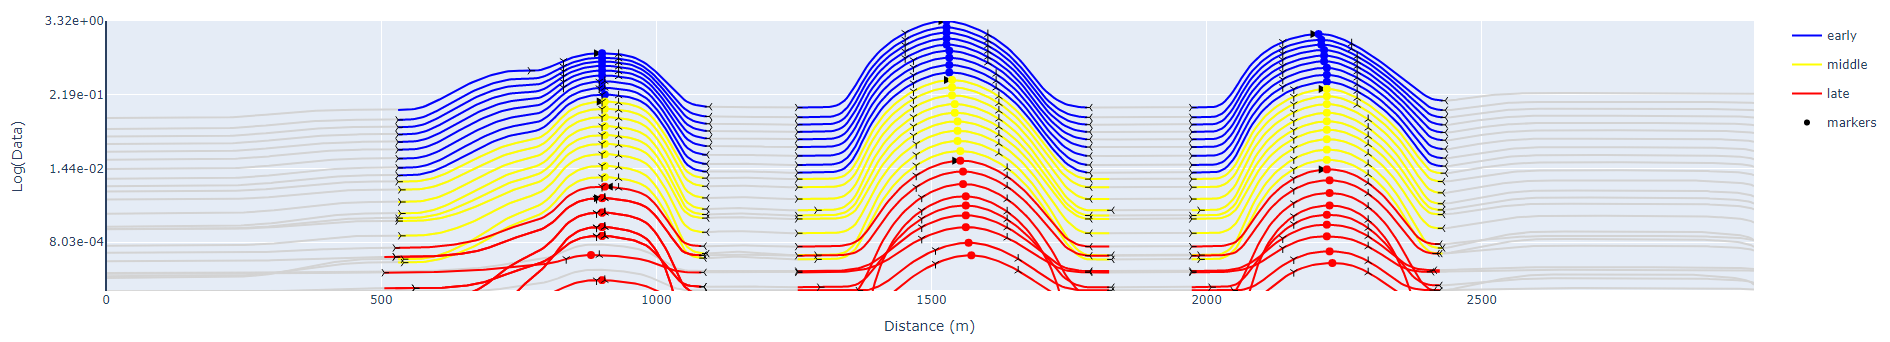
Fig. 5 Markers are used to indicate the left and right edges, the center, and the inflection point in curvature of each anomaly.
Data Selection
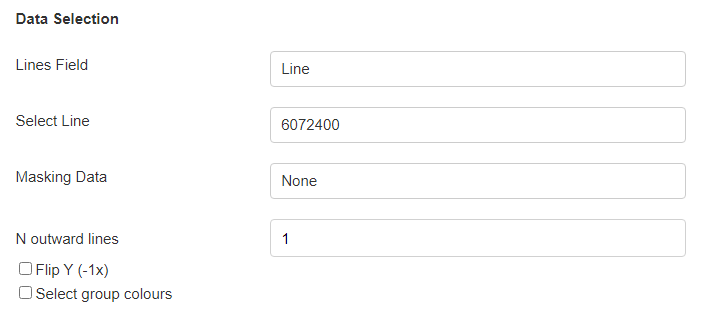
Lines Field
- property PeakFinderParams.line_field: ReferencedData
Object containing line ids and associated names.
Select Line
- property PeakFinderParams.line_id: int | None
Index of the currently selected line.
Todo
Add a figure showing the plan view line selection (black).
Masking Data
Todo
Add a figure of a working masked result.
N outward lines
Includes N lines in plan view on either side of the selected line.
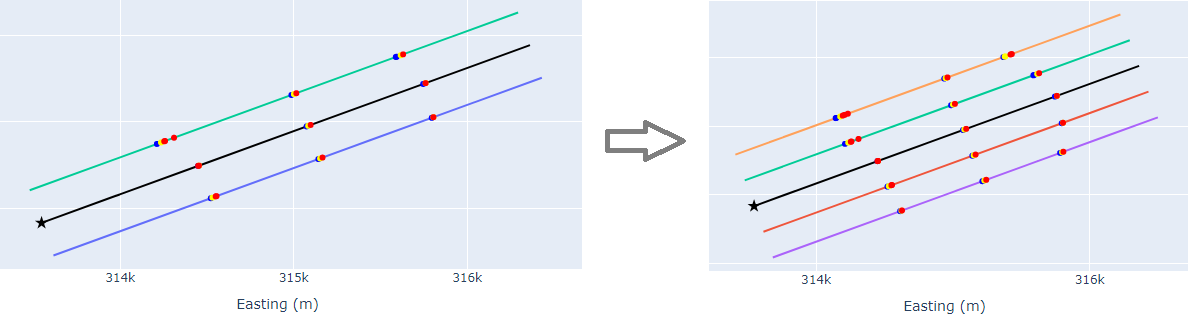
Fig. 6 Comparing the plan view with 1 outward line (left) and 2 outward lines (right).
Flip Y (-1x)
- property PeakFinderParams.flip_sign: bool
Flip sign of data.
Todo
Update docstring and add figure showing the effect of flipping y.
Select group colors
Todo
Add figure of color picker widget. Move this ui to visualization group?
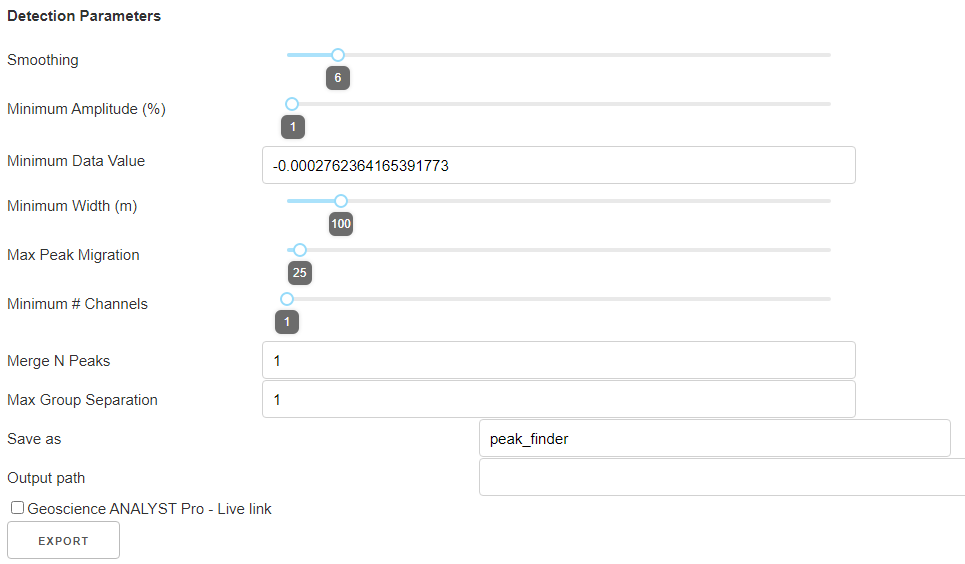
Detection Parameters
The detection parameters are those that the peak-finder application uses to tune the characterization and detection of anomalies within the data. Most of these are already described in the Methodology section. Follow the links for detailed descriptions of each parameter.
Save as
- property PeakFinderParams.ga_group_name: str | None
Name of group to save results to.
Todo
Update docstring and add figure showing resulting object saved in GA.
Output Path
Provide absolute path to save the output to.
Geoscience ANALYST Pro - Live link
If selected the output will be imported to the open GA sessions geoh5 file.
EXPORT
Saves the result